Why Fiber Optic Patch Cords Fail: What Every Engineer Must Know About UPC vs APC Mismatches
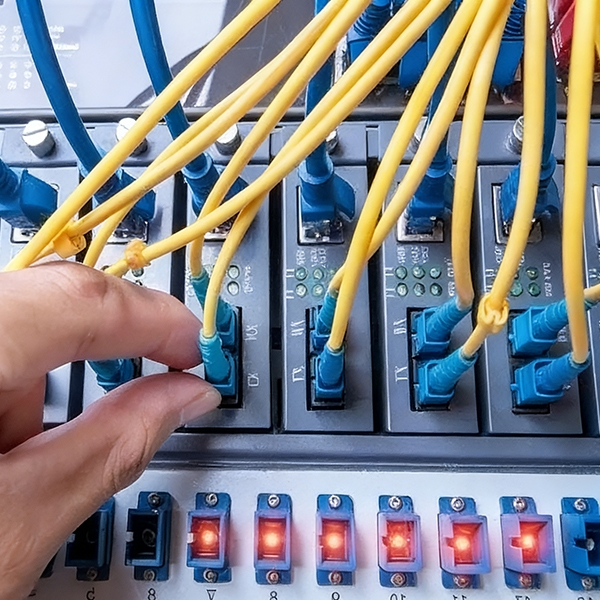
In a large data center, a small mistake caused a major interruption. A connector change that seemed simple resulted in the shutdown of the entire facility. A blue UPC connector (with a flat, dome-shaped ferrule) was to be connected to a green APC port (at an 8-degree angle). While this was only a minor issue, it greatly affected both the optical alignment and, as indicated by test results in the field, return loss, which ideally should be approximately -65 dB, increased to 20 dB or more because of light reflecting into transceiver modules. The result of feedback at the point of connector-to-cable caused thermal overload, erratic channel performance, and ten and forty gigabit failures among the channels on multiple links.
This disruption was caused not by the physical characteristics of the fibers but rather by how the connectors were manufactured. Fiber optic patch cords, which connect the fiber cables to network devices, are key components in ensuring proper optical alignment. Analysis after the fact shows that having the fiber connectors polished with consistent geometries is a must-have for the optical reliability of the entire optical communications chain. Simple practices that included routine inspections of the end faces and verifying and documenting the geometries of each connector would have prevented the complete failure. The accuracy of connector geometries is now a critical component of high-speed optical networks; with today’s high-speed operation, the manner in which you maintain connector geometries will either ensure stable network performance or the possibility of unplanned downtime.
20 dB Disaster—How a Mismatch Turns Light Into Data Loss
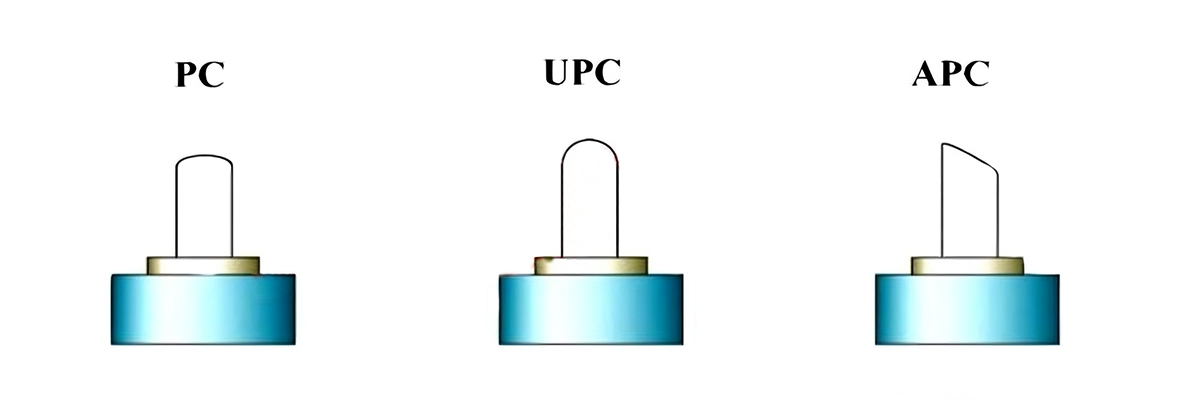
The greatest optical degradation results from connections between two fiber optic cables rather than through the entire length of the fiber. UPC connectors employ a rounded, finely polished end face to reduce direct or back reflections, typically keeping back reflections at or below -55 dB. The APC connector builds upon this capability and provides an angle on the polished surface to direct back reflections away from the core of the fiber and achieve approximately -65 dB back reflections. The slightly angled surface enables the return light to avoid entering the transmitter again, which is critical to keep the signal in a stable condition.
The connection between the UPC type plug and the APC type socket can cause issues due to the difference in the angle of the surfaces; therefore, there will be incomplete physical contact resulting in an air gap at the interface. Upon the introduction of light into the air gap, the light behaves according to the laws of refraction, and due to the abrupt transition between the refractive indices of air and glass, there will be a strong reflection occurring, causing high levels of return loss in the field (up to ~20 dB), many times higher than the designed specifications. As a result of this feedback, when it enters the transmitter optics, it can overload the receivers causing jitter, distorted waveforms, and thermal damage within the transceivers.
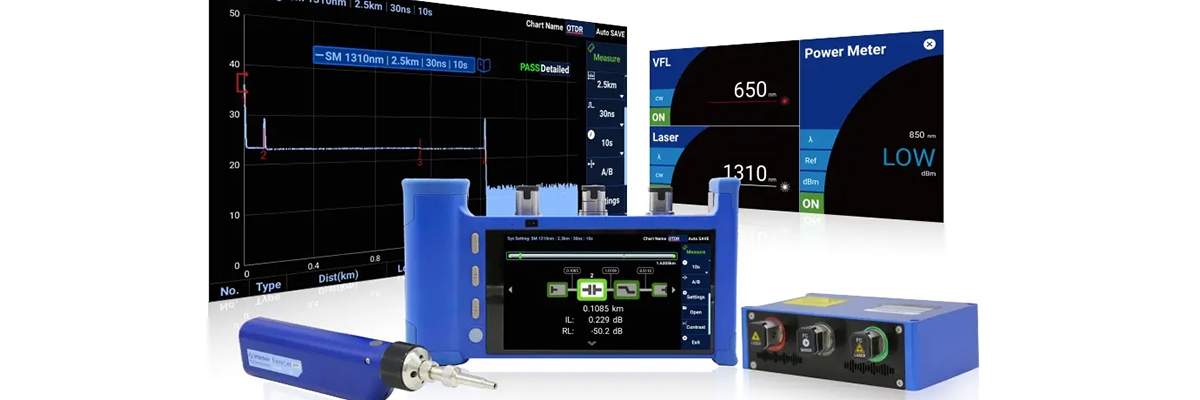
The mismatched connection can typically be seen using an optical time domain reflectometer (OTDR) test as a distinct reflective peak within the first meter of the trace. The higher the data rate (i.e., 40G, 100G, etc.), the tighter the tolerance, and therefore the more severe the effects of the mismatched connection. Therefore, optical systems that are reliable are not only reliant on clean fiber but also on geometrically precise end-faces.
 Zero Loss Polish Matching Matrix—Engineer’s Quick Reference
 Zero Loss Polish Matching Matrix—Engineer’s Quick Reference
How well light travels through a network from connection to connection largely determines the optical integrity of any network overall. To provide for the proper flow of signals and balance of energy in a network, the connectors should be paired correctly (for example: matching UPC to UPC or APC to APC). By reviewing field data collected on previous installations, it becomes clear that mismatched pairs lead to greater overall return loss and increased costs associated with maintenance. The average insertion loss on a matched pair of connectors operating at 10 Gbps will be around 0.2 dB, while the average return loss will be less than -55 dB.
However, in a mixed connection configuration using the same paired connectors, the average return loss will be 5–10 dB higher than a matched pair and may even disrupt the temperature shift testing done by monitoring systems. Between 40 and 100 Gbps, reflected signals increase greatly, and when using mismatched connectors, return losses are increased 15–20 dB due to observed conditions. This return loss is sufficient to cause link instability. The critical point occurs at 100 Gbps, where return losses exceeding 22–30 dB occurred in both laboratory and field tests from the UPC-APC connection.
 These return losses created an unacceptable amount of interference when connected with multiple wavelengths. For 400 Gbps, if any misaligned connector is used, it has the possibility (in a worst-case scenario) of causing a return loss of more than 35 dB, which results in an almost instantaneous loss of traffic over the affected channel. Every 10 decibels of reflected power roughly represents a factor of 10 increase in transmitted power back to the source. Therefore, the degradation of an optical link from reflection will occur exponentially rather than linearly.
While hybrid adapters may provide short-term solutions to eliminate certain reflection problems, most of those adapters will still create reflections in excess of 40 dB, which will not work for most high-precision applications. Therefore, the most effective solution to creating optical links is to use matched geometries. Using optical scopes, or using automated ID marking methods, prior to connecting cables can help engineers verify the types of polishes before they make connections and can avoid more than 85% of reflection-induced optical link failures. Geometric alignment is a good practice and thus represents a very important aspect of maintaining uptime.
How to Avoid OEM Mislabels and Pick Reliable Suppliers
Mislabeling in the supply chain is a subtle yet significant cause of network underperformance; not all operational failures take place on-site. For example, post-event inspection has shown many cables sold as APC cords actually had UPC ferrules inside the green housing. These types of inconsistencies can easily go undetected by visual inspections and will cause problems for already deployed links once they become live. The performance of a connector is affected by both the manufacturing precision and the integrity of the connector’s documentation.
An APC connector has three measurable parameters that define it: the radius of curvature is typically between 10 and 12 mm; the apex offset is typically within 50 μm of its center; and the angle deviation is normally no greater than 8° plus or minus 0.25°. By use of automated interferometry to check these parameters, uniform performance can be assured with respect to all manufactured APC connectors. Any deviations from these specifications will result in degradation of performance, in addition to introducing micro-scratches that may cause indefinite reflections from the surface of the ferrule. The effects of vibration and microscopic dust accumulating over time can lead to increased signal losses generated by even tiny surface defects.
To comply with IEC 61300-3-35 standards, top-tier manufacturers conduct quality control using automated solutions. They generally maintain insertion loss levels below 0.3 dB and return loss levels below -60 dB for their products. Mid-tier manufacturers often apply a combination of automated and manual processes to produce their products, and while they may still produce compliant products, they exhibit higher levels of variation than those of the top-tier manufacturers. Basic manufacturing facilities that produce products without regulation generally have field failure rates exceeding 20% and should be treated with caution.
 To assess vendor reliability, engineers employ a three-phase process. The first phase involves confirming the ferrule color through visual verification and verifying that it corresponds with the vendor’s technical documentation. The second phase then involves a request for the vendor’s interferometer report that provides detailed curvature and angle deviation data. The final phase involves performing a brief inspection of the product’s end face with the aid of a microscope prior to installation.
When conducted collectively, these three phases of the engineer’s assessment process will eliminate the vast majority of defects associated with supplier products. The best indication of compliance with standards will be a continued stable operational performance of the installed products over a period of months post-deployment. Companies that perform structured vendor assessments achieve lower error rates and fewer instances of complaints about reflection regarding their products, indicating that the quality of optics used in a network starts with verified, reliable sources. The success of modern networks is dependent on the ability of companies to acquire the correct materials at the correct time to maintain full operational capacity.
20 dB Disaster Revisited—Field Insight from Real Testing
Engineers relied upon OTDR testing as the main method for locating concealed sources of reflection during an unexpected decline in network functionality. Typically, an engineer’s first indication of a connector mismatch is a sharp increase of over 14 dB at less than one meter from the port. In one instance documented through field testing, a UPC/APC connector configuration created this very same reflection at the transmitter’s interface. This reflection returned energy to the lasers, which caused them to generate an increased amount of heat and resulted in a rapid increase in errors counted by forward error correction methods used by the lasers.
When the protective mechanisms for the lasers were activated, the ports were automatically deactivated to prevent further damage. The matched-connectors replacement generated immediate recovery: return loss improved to nearly –65 dB, insertion loss stabilized under 0.2 dB (max), and OTDR traces recovered to near-burst levels. Feedback from observers described this change as “going from echo-filled feedback to completely silent,” which indicates optical alignment accurately. The same pattern was seen in all repeated measurements: conventional mismatched surfaces cause excessive feedback (amplifying the reflection), whereas conventional matched surfaces provide a restoration of equilibrium.
Identifying these patterns makes it easier for troubleshooting teams when conducting root-cause analysis of problems. The most important point to note is that fiber degradation does not usually cause system disruptions; rather, these disruptions frequently occur as a result of tiny mechanical mismatches at the connector face.
How to Detect an 8° Angle in 3 Steps
 How to Detect an 8° Angle in 3 Steps
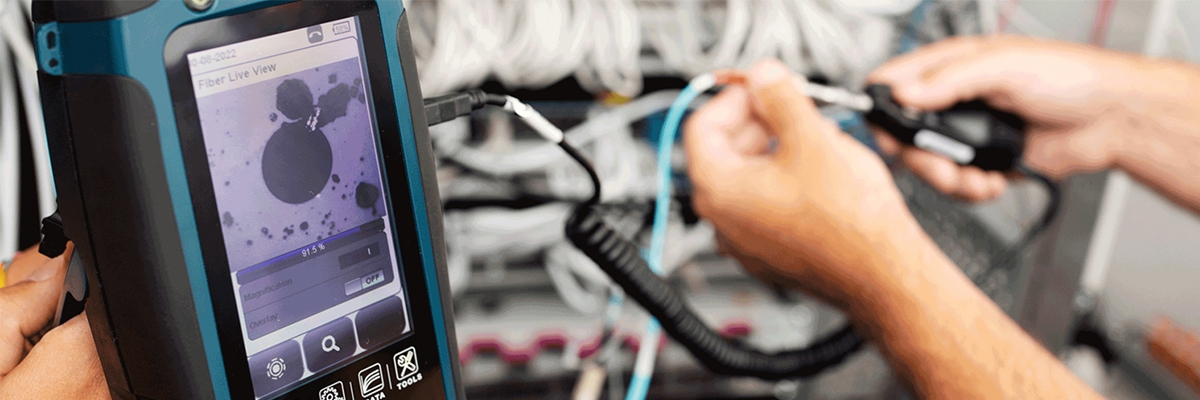
Field engineers depend on repeatable routines to verify the dimensions of connectors prior to activating them. By having a defined sequence for inspection, nearly all instances of mismatches can be avoided. The first step in the inspection sequence is to clean the ferrule surface. Dust, residue, or oil from fingers interfere with the light that reflects from the ferrule surface; therefore, they also cover any scratches on the surface, making them undetectable by the technician and preventing an accurate polish assessment.
Technicians will use an isopropyl alcohol-soaked lint-free wipe to clean the ferrule using straight lines, not a circular motion, and then use compressed, fully dried air to blow off any moisture left on the ferrule after cleaning. Once a cleaned ferrule is inspected under magnification between 200x and 400x, the polished surface can be seen and verified by the technician to be geometrically perfect. A UPC ferrule will show a symmetrical shine when viewed through magnification, while an APC ferrule will show a reflectively angled elongated ellipse when viewed through magnification. The latest digital microscopes enable technicians to determine the actual angle of polish to within a half-degree.
However, any polish angle deviation of one degree or more, as well as any visible imperfections, would result in the ferrule being rejected. Documentation is the last step of the process. Every image taken by the engineers is recorded and attached to the serial number of the cable. The results of these documents are kept in an archive for future audits and maintenance.
As more and more documents are archived, the documents act as a data set for an engineer to determine what the wear and tear on a connector was by a supplier, based on that supplier’s batch. The time it takes to complete the procedure for a connector is generally less than a minute. However, the benefits of determining if a link will be unstable and providing the troubleshooting time required to fix it are invaluable, as is the longer lifespan of the connector. The idea of “scope before you plug,” which is the principle that governs the discipline of a field engineer in ensuring that a correct physical connection meets the geometric requirements of the connection for the best chance of operating reliably at high speeds, remains a central principle of a field engineer’s discipline.
Diagnosing a $10,000 Outage with OTDR
 Diagnosing a $10,000 Outage with OTDR
Multiple racks of 40G in an enterprise environment failed to communicate with each other within the switches. At first, the suspicions were that it was going to be a bad module, but the testing done using an OTDR revealed a reflection peak toward the end of the run which measured approximately 24 dB half a meter from the transmit side of the transmission. The cause of this reflection peak could not be found by any of the possible reasons related to a bend in the fiber or contamination of the fiber. When the installer completed visual inspection, they found the actual problem; a single blue UPC jumper was inserted into a green APC patch panel; therefore, the light was being reflected off of the inside of the transceiver due to the angle mismatch, which caused the temperature of the optical modules to rise nearly 15°C.
The increase in temperature led to a reduction in the power output and, as a result of the increase in temperature, the ports were automatically turned off to prevent damage to the hardware caused by excessive stress due to temperature. In an enterprise network, several racks of 40G switches were unable to communicate with each other. Initially, it was suspected that one of the modules was faulty, but testing using an Optical Time Domain Reflectometer (OTDR) showed a reflection peak at the end of the cable run that measured about 24 dB, which was located approximately half a meter from the transmitter end of the cable. However, the reason for the reflection peak could not be determined based on any of the possible causes of fiber bends or contamination.
During the installer’s visual inspection of the patch panel, they discovered the root cause of the problem; a blue UPC connector had been plugged into the green APC patch panel. This caused the optical signal to reflect back into the transceiver at an angle that mismatched the design of the transceiver and ultimately caused the temperature of the optical modules to increase by nearly 15°C. The heat generated due to the mismatch caused a decrease in output power from the transceiver and, ultimately, the optical modules automatically turned off in order to protect them from overheating caused by the temperature spikes.
Why Matching Polish Saves High-Speed Networks
 Why Matching Polish Saves High-Speed Networks
The overall effect of each reflection on optical efficiency and reliability is only diminished. Mismatched connector types, like UPC versus APC, illustrate how small deviations in connector geometry influence reflections so strongly that they may interfere with critical communications. Thus, the goal is clear: the connector shapes must fit together properly so that the light travels unidirectionally, and reflections are not returned to the source. Ensuring that the optical connections are properly aligned with one another using optical scopes and interferometers provides an easy way to guarantee a maximum amount of bandwidth, in terms of operational limits or downtime.
With network performance at 100G and 400G, this is especially important, as the operational margins become tighter with higher volume. Through matching polishes, validating manufacturers’ specifications for equipment, and creating and maintaining an inspection history, you create a way to measure reliability. In the context of fiber networks, Physical Precision offers Operational Confidence. Reliable performance of the fiber network is achieved through consistency in the grinding process to maintain an 8° polished surface and a defect-free contact area.
As stated earlier, precision verification provides the quickest, lowest-cost solution to provide insurance against unanticipated downtime. Therefore: Scope Prior and Geometry handles the rest.
📚 Reference Sources
- Key Errors and Apex Offset in APC Connectors: Technical analysis of APC connector geometry errors causing air gaps, return loss degradation, and UPC-APC mismatch issues in fiber optic networks.
- Causes of Return Loss at Mated Single Mode Fiber Optic Connections: Detailed study explaining refractive index mismatches and physical contact failures leading to high return loss in fiber optic patch cord connections.
- Fiber Optic Tips – APC vs UPC Optical Connectors: Practical guide on APC vs UPC connector differences, mating risks, and performance impacts relevant to patch cord reliability.
- APC vs PC Connectors: Engineering paper comparing angled vs flat polished connectors, return loss specifications, and mismatch consequences in optical systems.
- Technology and Testing – FTTx PON: Industry reference on UPC/APC optical return loss standards (50-70 dB) and connector performance in high-speed fiber networks.
- Fiber Optics Failure Modes and Mechanisms: IEEE paper examining common fiber optic connector failures, including polish mismatches affecting signal integrity and network downtime.